
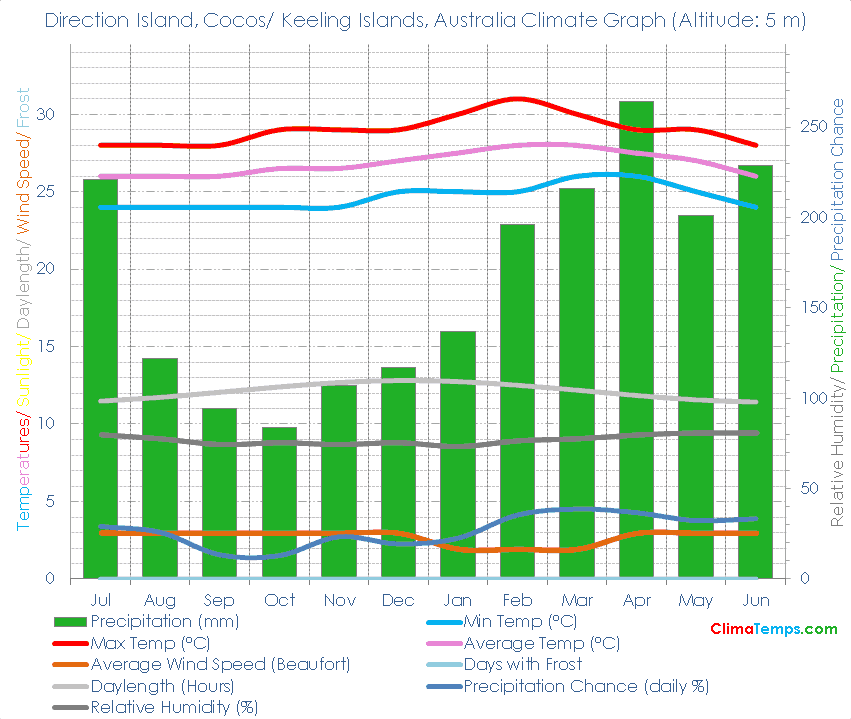
🌡️ The mean annual temperature is 26.8 degrees Celsius (80.3 degrees Fahrenheit). See the temperatures page for a monthly breakdown and the fixed scale graph.
🐬 Average monthly temperatures vary by 2 °C (3.6°F). This indicates that the continentality type is hyperoceanic, subtype extremely hyperoceanic.
☔ Total annual precipitation averages 1988 mm (78.3 inches) which is equivalent to 1988 Litres/m² (48.76 Gallons/ft²).
Simply paste the following HTML code into your webpage. Please include a link back to this website. There is one in the following code already. Edit the width attribute to change the size of the graph if needed:
✨ The longest day of the year is 12:42 long on the 21 of December and the shortest day is 11:17 long on the 22 of June.
🐇Were you to burrow down through the centre of the Earth from Cocos/ Keeling Islands you would pop up nearest to the climate station at Bluffields, Nicaragua where you would find a Tropical wet climate (Subtropical wet forest biome).
🌍Direction Island, Cocos/ Keeling Islands, Australia is at 12°4'S, 96°52'E, 5 m (16 ft). Check the location on the map.
| Climate Variable | Jul | Aug | Sep | Oct | Nov | Dec | Jan | Feb | Mar | Apr | May | Jun | Annual | ||
|---|---|---|---|---|---|---|---|---|---|---|---|---|---|---|---|
| Average Max Temperature °C ( °F) | 28 (82) | 28 (82) | 28 (82) | 29 (84) | 29 (84) | 29 (84) | 30 (86) | 31 (88) | 30 (86) | 29 (84) | 29 (84) | 28 (82) | 29 (84) | ||
| Average Temperature °C ( °F) | 26 (79) | 26 (79) | 26 (79) | 27 (80) | 27 (80) | 27 (81) | 28 (82) | 28 (82) | 28 (82) | 28 (82) | 27 (81) | 26 (79) | 27 (80) | ||
| Average Min Temperature °C ( °F) | 24 (75) | 24 (75) | 24 (75) | 24 (75) | 24 (75) | 25 (77) | 25 (77) | 25 (77) | 26 (79) | 26 (79) | 25 (77) | 24 (75) | 25 (76) | ||
| Average Precipitation mm (in) | 221 (9) | 122 (5) | 94 (4) | 84 (3) | 107 (4) | 117 (5) | 137 (5) | 196 (8) | 216 (9) | 264 (10) | 201 (8) | 229 (9) | 1988 (78) | ||
| Number of Wet Days (probability of rain on a day %) | 9 (29) | 8 (26) | 4 (13) | 4 (13) | 7 (23) | 6 (19) | 7 (23) | 10 (35) | 12 (39) | 11 (37) | 10 (32) | 10 (33) | 98 (27) | ||
| Average Daylight Hours/ Day | 11h 28' | 11h 43' | 12h 03' | 12h 23' | 12h 40' | 12h 48' | 12h 44' | 12h 30' | 12h 11' | 11h 50' | 11h 33' | 11h 25' | 12h 00' | ||
| Sun altitude at solar noon on the 21st day (°). | 57.4 | 65.8 | 77.1 | 86 | 81.5 | 78.6 | 81.7 | 86.3 | 77.6 | 66.1 | 57.7 | 54.5 | 72.5 |
Please take a moment to share a climate graph or simply the address:
Thank You, so much! ❤️